
● Filed · N-Smart · US electric utilities · case file 3.24
Poles, tools and warehouses — a US utility's assets in one model
Strategy, interface concepts and front-end build on V1 of N-Smart's grid asset platform for US electric utilities — poles in the field, tools in trucks and stock in warehouses under one data model. Brief to shipped V1 in four months.
Overview
Strategy, interface concepts and front-end build on V1 of N-Smart's grid asset platform for US electric utilities — poles in the field, tools in trucks and stock in warehouses under one data model. Brief to shipped V1 in four months.
My role
Strategy, concepts & front end
Team
- GA
- NV
Ganesh A · Nikith Vijay
Built with
Figma
Timeline
Apr — Jul 2025 · 4 months
Filed
● Impact overview
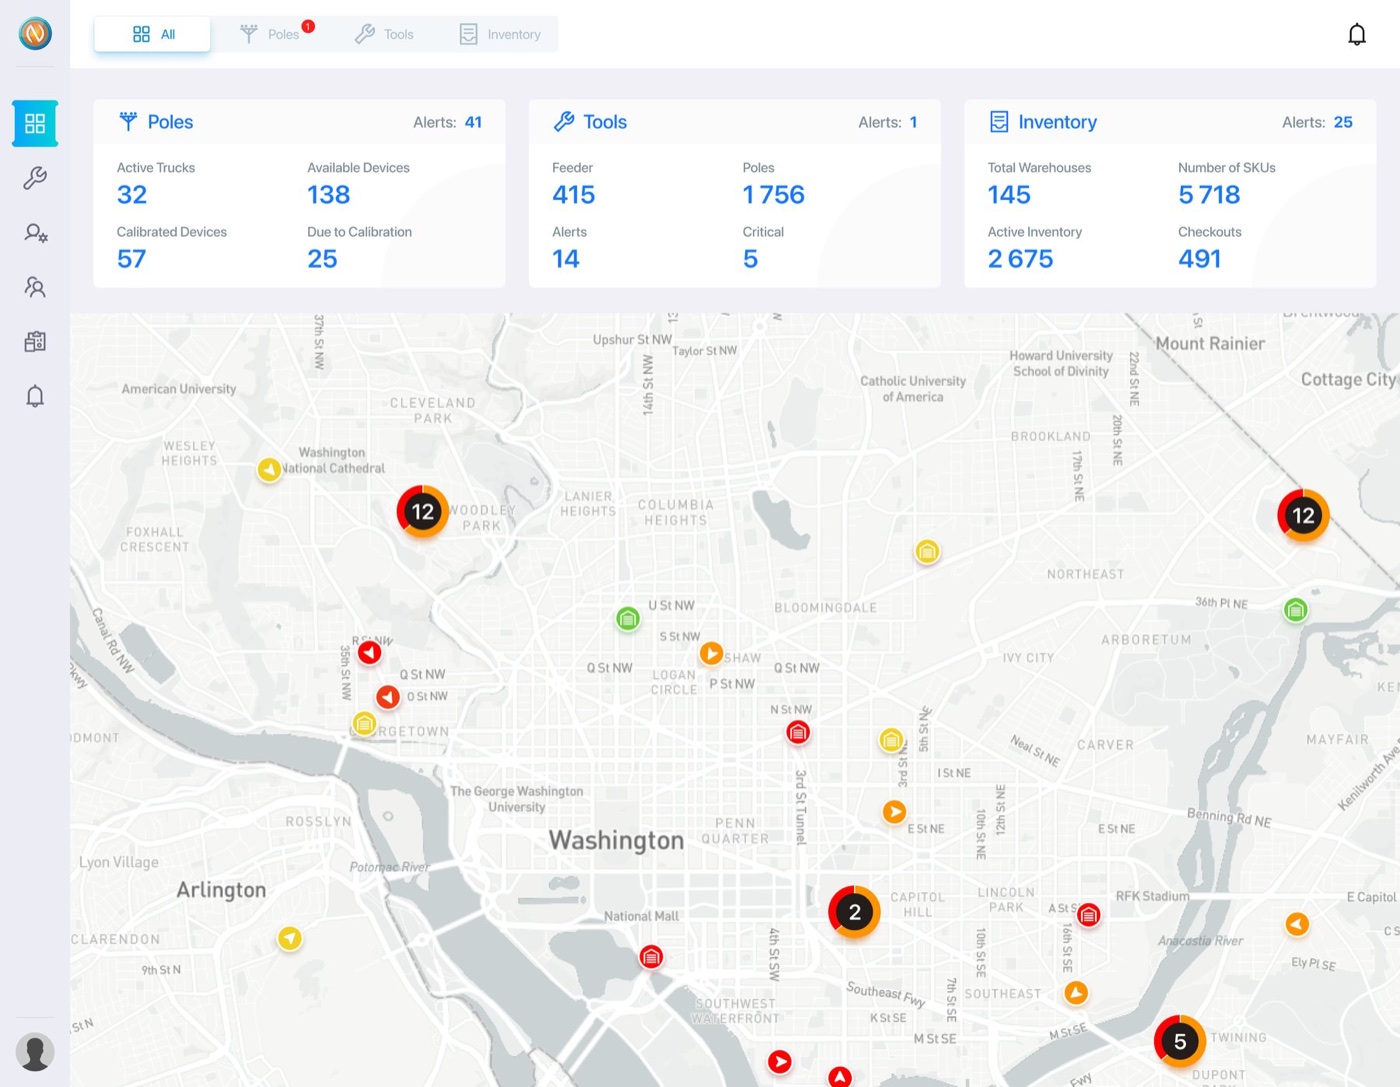
- One model for everything a utility ownsPoles, tools, warehouses and trucks under three pillars and one roll-up, so a tilt alert already knows its feeder, its service center and the crew that can reach it.
- Shipped in four months, on scopeThe strategy was to build the record before the smart layer. V1 held to that, shipped in July 2025, and the AI layer N-Smart sells today runs on top of it.
- Alerts a crew keeps switched onThresholds tuned per feeder, only two of three bands raising work, and the two tool states that actually cost money — Missing and Cross-Track — surfaced by design.
01
What it is
N-Smart builds sensor technology for electric utilities in the United States. Its customers own an enormous amount of physical stuff spread across a lot of ground: poles standing in weather, calibrated test equipment living in trucks, warehouses of parts feeding crews who are rarely in them. V1 was the platform that tracks all of it — poles, tools and inventory — before any of the clever sensor logic could sit on top.
That order matters. A tilt reading from a pole means nothing unless the system already knows which feeder the pole is on, which service center owns that feeder, and which truck has the tools to go and fix it. V1 was that model, and the interface an operator sits in front of to read it.
02
My half of it
GetMyCreative took the build on with two of us on it. Nikith, the tech lead, ran product day to day — the user stories, the flows, the wireframe board. I owned the strategy of the build, the concepts the interface is built on, and the front end itself.
Strategy meant deciding what V1 was actually for, and holding the line on it for four months. The founders wanted the smart layer — risk scores, predictions, a sense-think-act loop. We argued that none of that survives a bad record underneath, so V1 would be the record: every pole, tool, warehouse and truck the utility owns, modelled correctly, with alerts that a crew would keep switched on. The predictive layer came later, as V2, and we make no claim on it.
03
The concepts
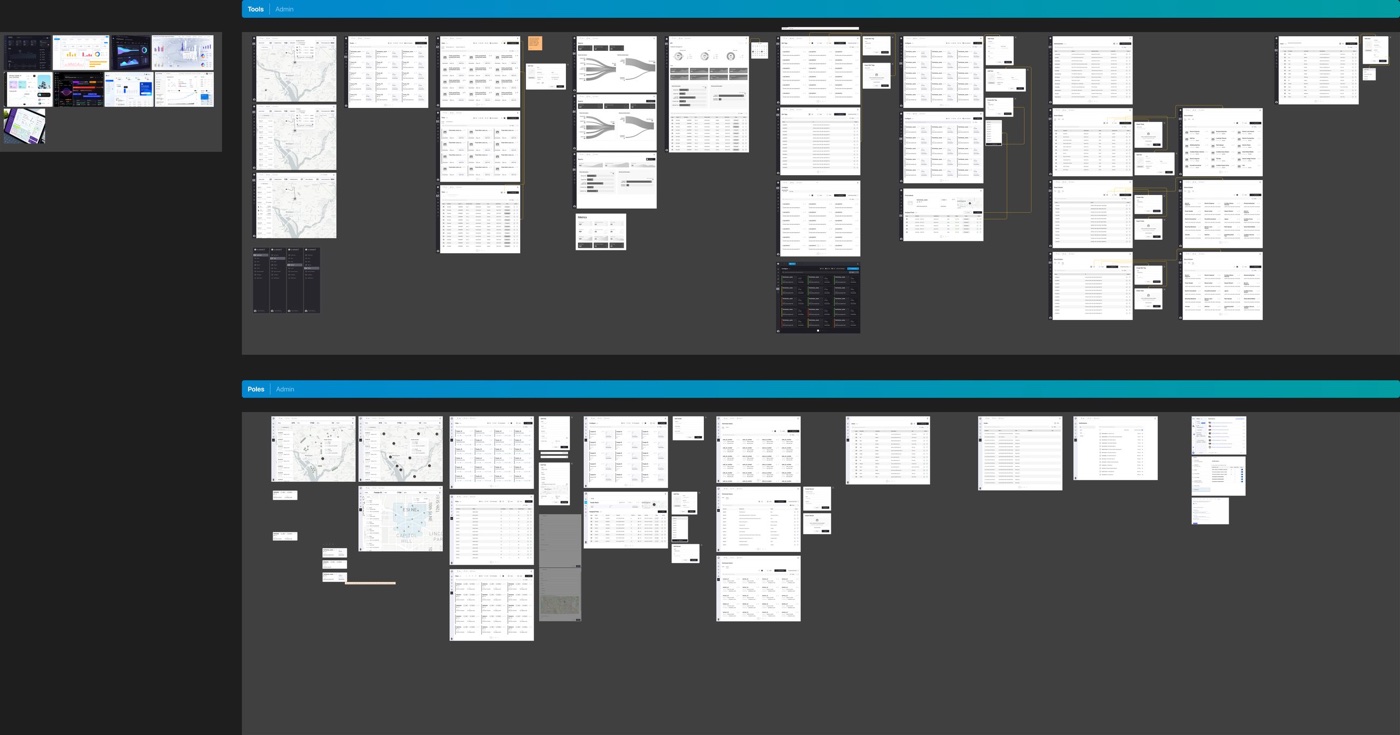
Everything in the product lives under one of three pillars — Poles, Tools or Inventory — with a roll-up dashboard on top that summarises all three and one live map underneath. A left rail cuts across the pillars for the things you do rather than the things you look at: reports, users, trucks, service centers. Two axes and nothing orphaned.
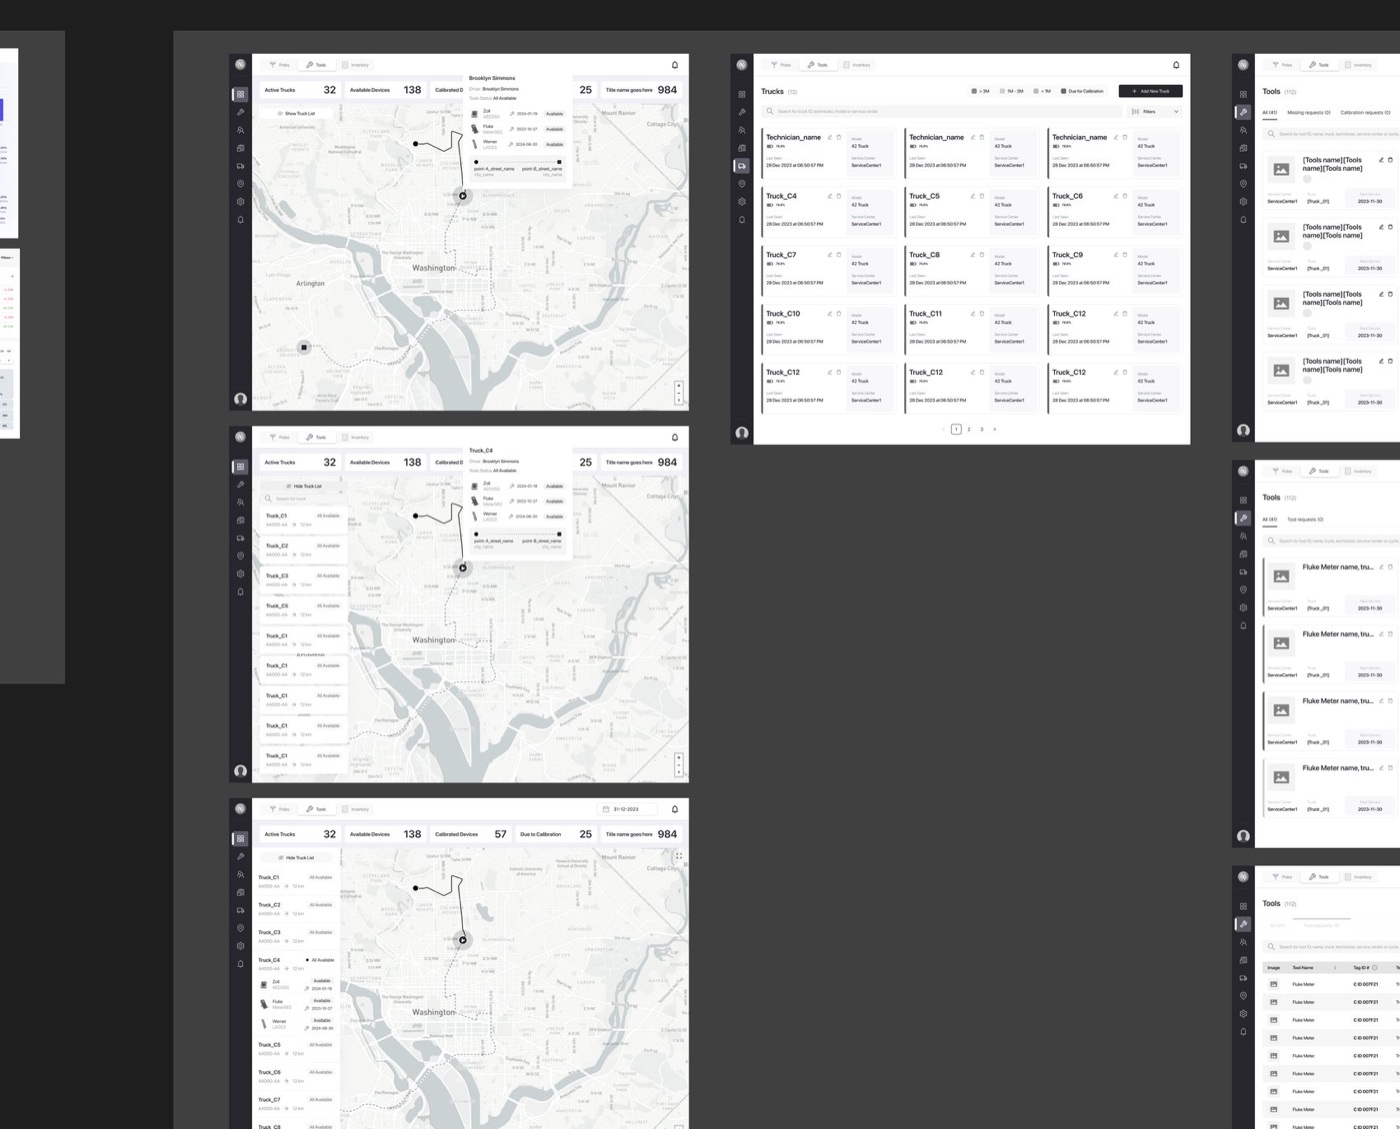
The load-bearing decision was that everything belongs to a Service Center — not the utility, not a region — because that is the unit a crew actually reports to. Permissions, stock and tooling all inherit from it. And rather than build vehicles as a fourth thing, a truck is a warehouse with a driver and a route. One inventory model covers a building and a Ford F-350, which is why a truck can carry a manifest and raise a missing-tool flag without a second system.
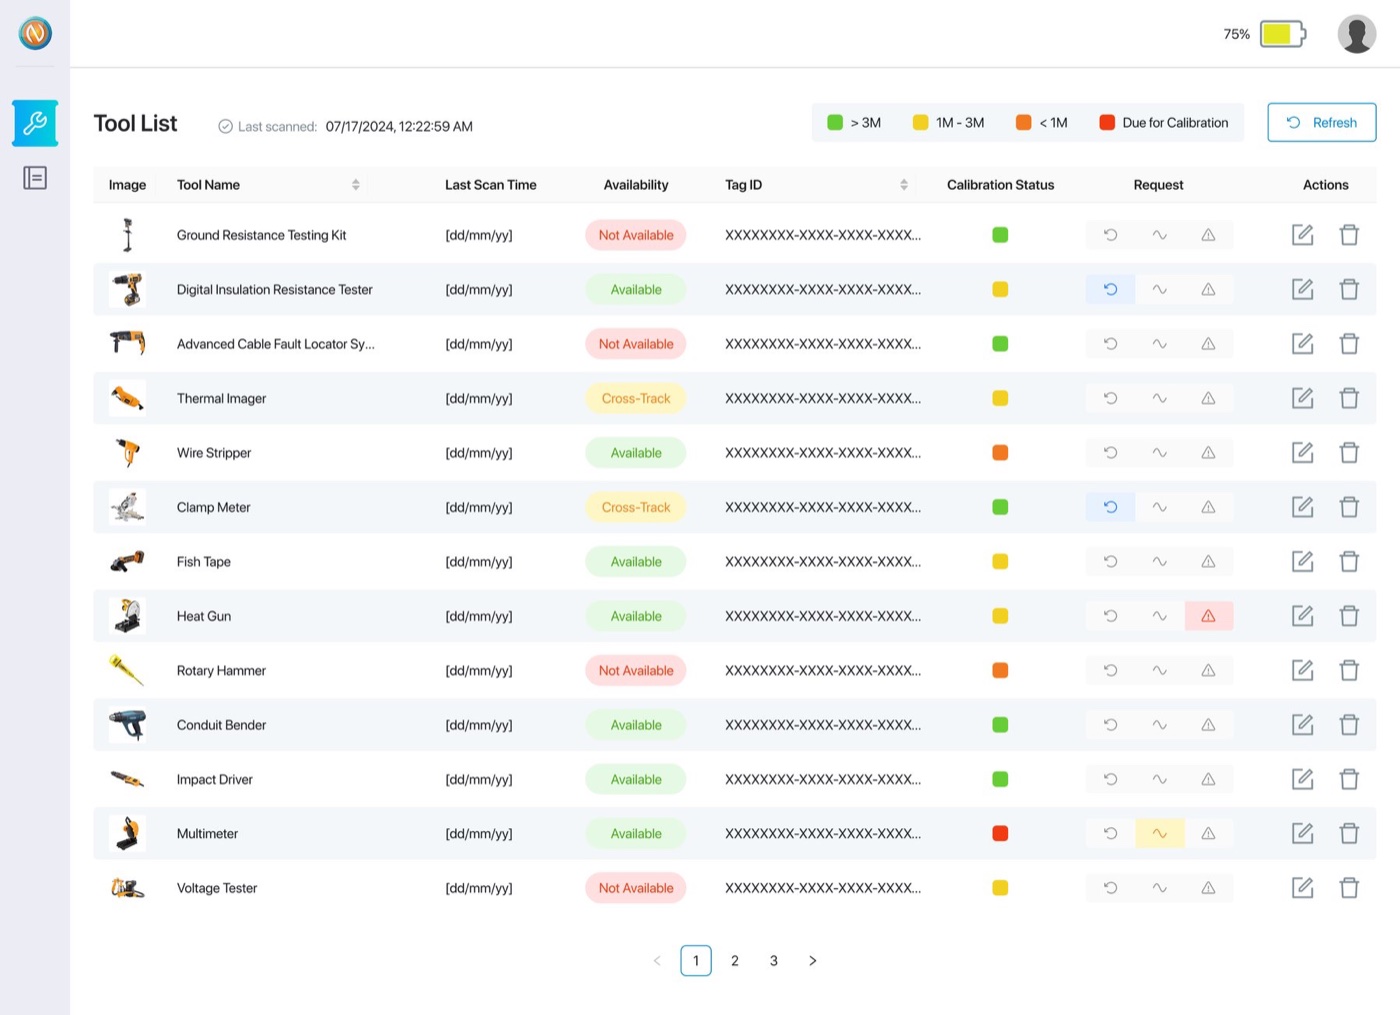
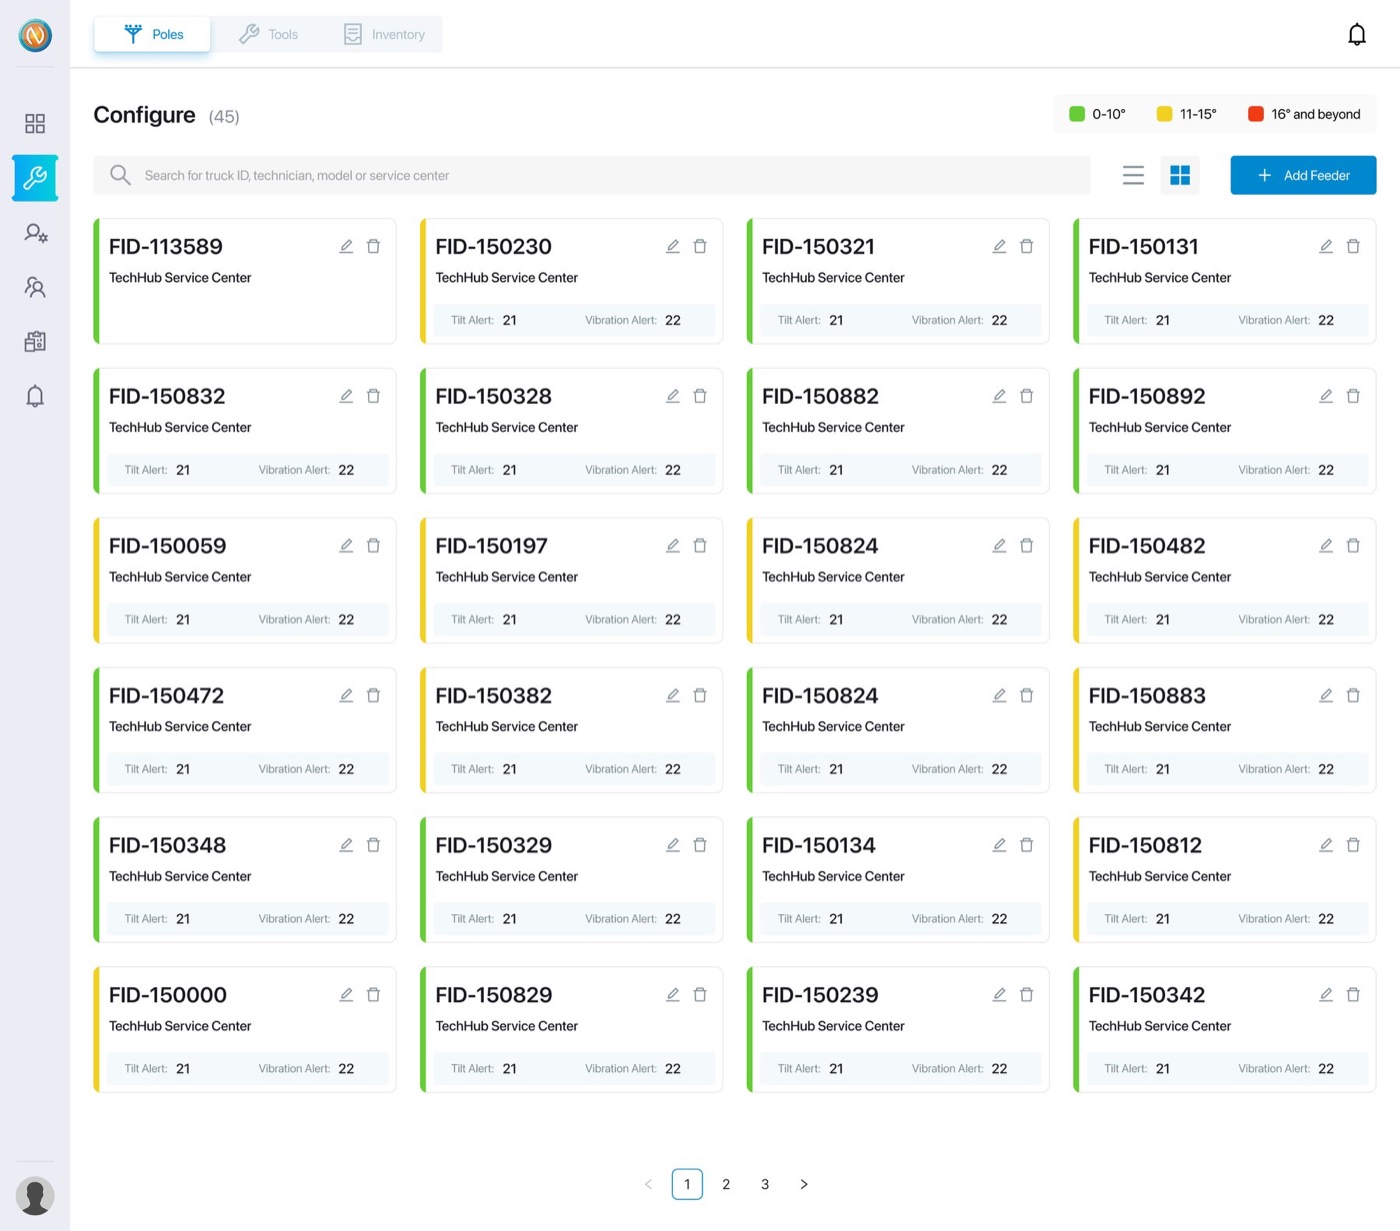
A tool is never simply present or absent; it is somewhere in a cycle — available, requested, checked out, scanned back in — with a calibration ladder above it that flags equipment before it goes out of date. The two states worth designing for are the expensive ones: Missing, no scan inside the window, and Cross-Track, scanned somewhere it does not belong, which is how tools actually disappear. On the pole side, tilt and vibration thresholds are set per feeder rather than hard-coded, because a coastal run and flat inland ground do not lean the same way, and an operator who cannot tune an alert will switch it off inside a week.
04
Building it
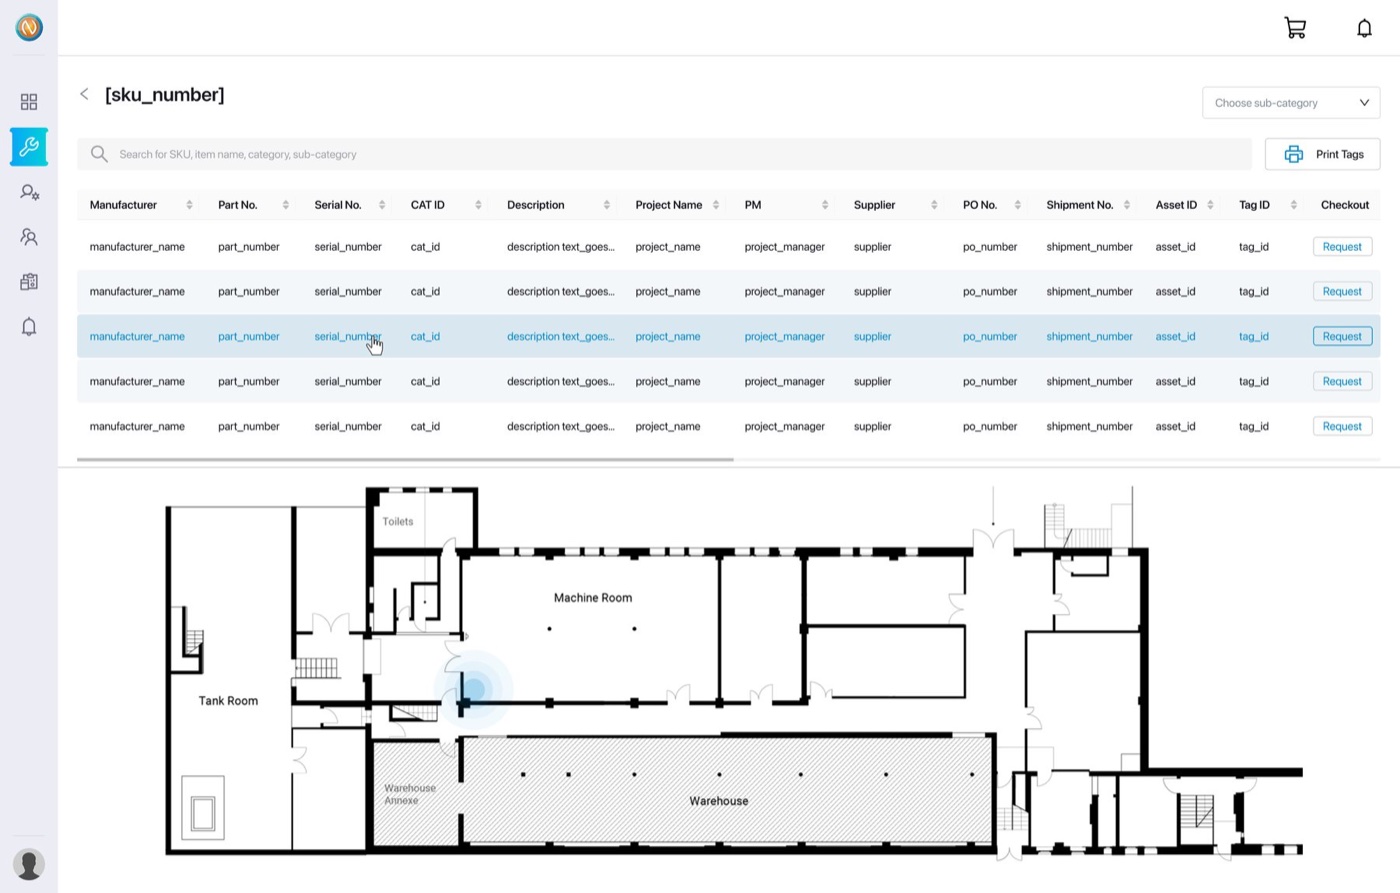
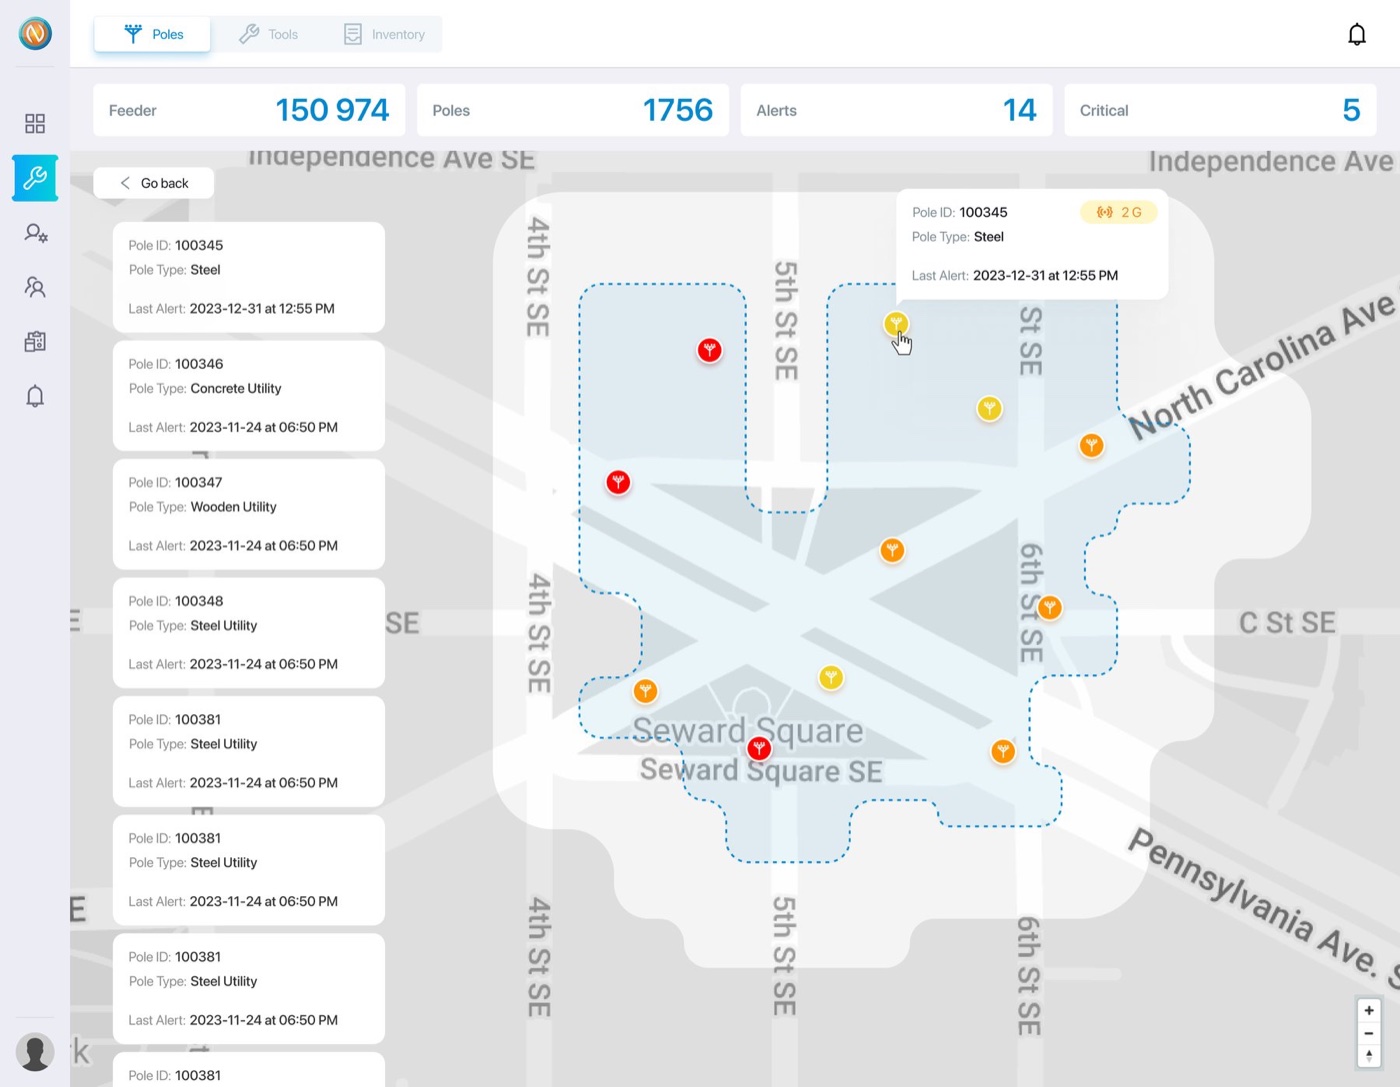
The same table view, card view, search and detail pattern repeats inside all three pillars — learn one and you can use the others — which also meant one set of front-end components carried most of the product. A design agency put the final visual polish on the screens; I took that and built the front end: the roll-up dashboard and its alert counts, the map with clustered markers inside feeder geofences, the tool list with its four-step calibration ladder, per-feeder threshold configuration, and warehouse pages with a SKU table above a live floor plan.
The other half of the work was talking to the people who carry the things. The founders gave us the vocabulary — feeders, pole types, what a service center is — but the behaviour came from N-Smart's field staff in the US: that a tool goes missing by being somewhere it shouldn't rather than by vanishing, that a crew will kill any alert it cannot tune, that a truck is functionally a warehouse. Those conversations are where the concepts above came from.
05
Where it stands
V1 shipped in July 2025 and was handed over: 112 service centers, 145 warehouses, 32 trucks, 415 feeders, 1,756 poles and 5,718 SKUs in the working model, with five roles scoping who sees which slice of it. N-Smart's platform today sells the AI layer on top. That is V2, built after us, on the model we shipped.
06
In pictures
07
What’s inside
- Roll-up dashboard with live map
- Poles inside feeder geofences
- Per-feeder tilt and vibration thresholds
- Alert history per pole
- Tool checkout loop
- Four-step calibration ladder
- Cross-Track and missing-tool flags
- Warehouse SKU tables over live floor plans
- Trucks as moving warehouses with manifests
- Service centers and five scoped roles
- Reports
08